


Tracking eCommerce KPIs is crucial for eCommerce merchants to make smart decisions and scale their online business. eCommerce KPIs, or Key Performance Indicators, serve as a north star for businesses, guiding them toward increased sales and earnings.
These metrics provide valuable insights into customer activity, sales results, marketing impacts, and overall business health.
These metrics will allow us to see how your customers interact with your online store, what they buy, their demographics, and where problems occur.
Tracking sales performance using KPIs such as average order value (AOV) and customer acquisition cost (CAC) enables you to refine pricing strategies and marketing campaigns to maximize profitability.
Understanding and monitoring eCommerce KPIs is not just about numbers; it’s about discovering the story your data tells. Interpreting trends and identifying correlations provides invaluable insights that drive informed decision-making.
Whether it’s optimizing product descriptions, personalizing email marketing campaigns, or streamlining the checkout process, eCommerce KPIs enable you to make changes that produce real results.
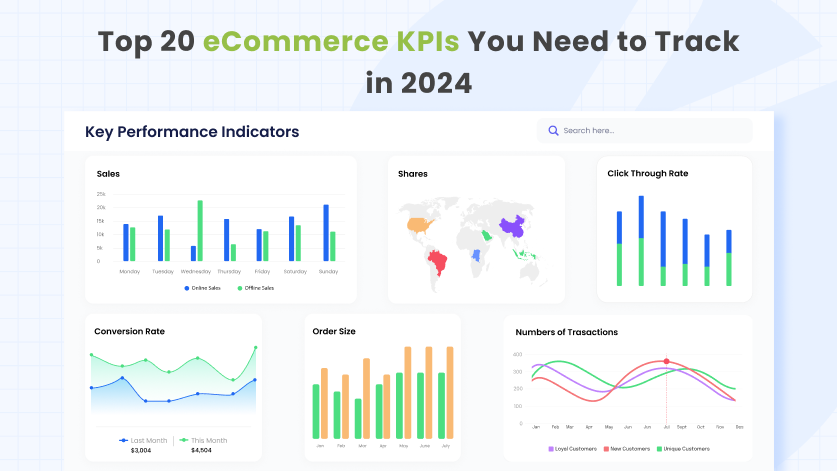
In this blog, we will go through the top 20 eCommerce KPIs to follow:
What are eCommerce Key Performance Indicators (KPIs)?
eCommerce KPIs are measurable metrics that businesses use to assess and quantify the effectiveness of their online retail operations.
These indicators provide valuable insights into various aspects of an eCommerce business, allowing stakeholders to make more informed decisions and refine strategies to achieve their goals.
But what exactly are KPIs? Imagine them as measurable data points that reflect your progress toward specific goals. Think of it this way: You wouldn’t drive across the country without a map and key milestones, right?
Similarly, KPIs provide a roadmap for your eCommerce customer journey, helping you track progress, identify areas for improvement, and ultimately achieve your business goals.
Why is it Important to Track eCommerce KPIs?
Tracking eCommerce KPIs is essential for the success and growth of online businesses. KPIs serve as measurable metrics that provide valuable insights into various aspects of an eCommerce operation, helping businesses make informed decisions and optimize their strategies.
1. Performance Measurement: eCommerce KPIs provide measurable insights into your online store’s performance and marketing efforts. By tracking metrics such as website traffic, conversion rate, and sales revenue, businesses can evaluate the long-term performance of their eCommerce platform.
2. Identifying Strengths and Weaknesses: Analyzing eCommerce KPIs can help you identify both strengths and weaknesses in your online business model.
For example, a low conversion rate may indicate problems with website usability or checkout processes. On the other hand, a high conversion rate may indicate a successful marketing strategy or product popularity.
3. Data-Driven Decision Making: KPIs enable data-driven decision-making by providing actionable insights based on real data rather than guesswork.
For example, if customer acquisition costs are high relative to customer lifetime value, businesses may need to rethink their marketing channels or customer retention strategies.
4. Optimizing User Experience: eCommerce KPIs can help you improve the user experience (UX) of your website or mobile app. Metrics like bounce rate and page views per visit show how engaged the customer is with your platform and where the UX can be improved.
5. Measuring Marketing ROI: eCommerce KPIs help measure the return on investment (ROI) of marketing campaigns and advertising channels. Businesses can determine which marketing channels are most effective and allocate resources based on metrics such as conversion rate by traffic source and cost per acquisition.
6. Competitive Benchmarking: Tracking eCommerce KPIs allows businesses to compare their performance with competitors in the industry. By comparing metrics such as market share and average order value, businesses can identify areas for improvement to compete.
Top 20 eCommerce KPIs for 2024
1. Revenue:
Revenue is the total income earned from sales of products or services within a specific period, indicating the financial performance of an eCommerce business.
The formula is simple: Revenue = Total Sales
For example, if a local bakery earns $500 from walk-in customers and sells $2,000 worth of cakes through online orders in a single day. The bakery’s revenue for that day is $2,500.
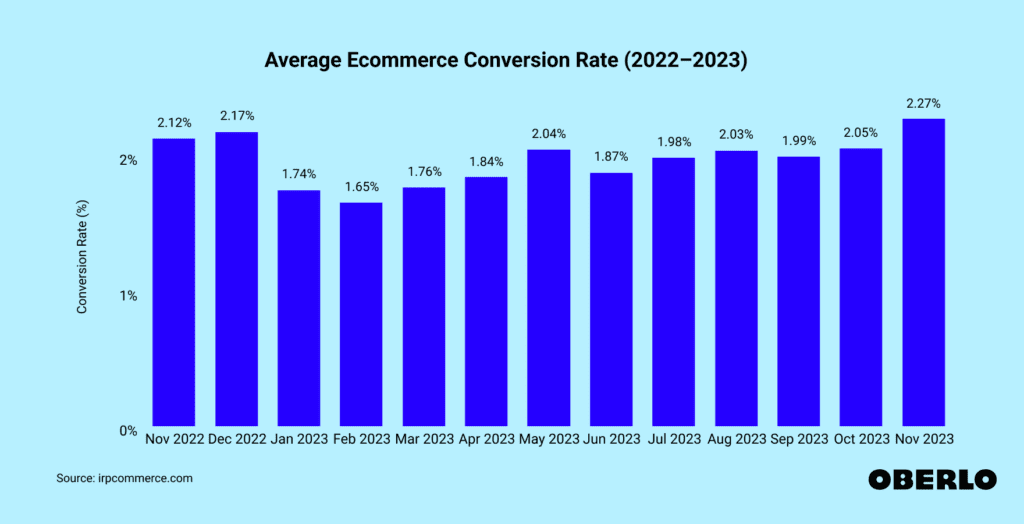
2. Conversion Rate:
The conversion rate measures the percentage of website visitors who complete a desired action, such as making a purchase or signing up for a newsletter, providing insights into the effectiveness of a website in converting visitors into customers.
Here’s the formula: Conversion Rate = (Number of Conversions / Number of Visitors) * 100%
For example, if a website receives 1,000 visitors in a month, but only 50 of them convert into paying customers. The conversion rate would be 5%.
3. Average Order Value (AOV):
The average order value (AOV) calculates the average amount spent by customers per order, helping businesses understand purchasing behavior and optimize pricing strategies.
To find out the AOV, follow this formula: AOV = Total Revenue / Number of Orders
For example, if a coffee subscription service has 1,000 orders in a month, with a total revenue of $20,000. This means the average order value of this coffee subscription service is $20 per order.
4. Customer Lifetime Value (CLV):
Customer lifetime value (CLV) estimates the total revenue a business can expect from a single customer over their entire relationship with the company, guiding decisions related to customer acquisition and retention.
Here is how you can calculate CLV: CLV = Average Purchase Value × Average Purchase Frequency × Customer Lifespan
For example, if a fitness tracker company has a customer who buys a fitness tracker for $100 and also signs up for a premium subscription for $10 per month, and continues to use the tracker and subscription for 2 years. This means that the fitness tracker company can expect this customer to earn $340 throughout their relationship with the company.
5. Shopping Cart Abandonment Rate:
Ever wondered about those who drop items in their cart but don’t buy them? The shopping cart abandonment rate captures this, showcasing hurdles in the buying process.
The formula for the abandonment rate is: Abandonment Rate = (Abandoned Carts Number / Total Carts Number) * 100%
For example, if an online clothing store has 1,000 website visitors in a single day. Out of these visitors, 200 added items to their cart, but only 100 completed the purchase. This means the online clothing store has a 20% shopping cart abandonment rate.
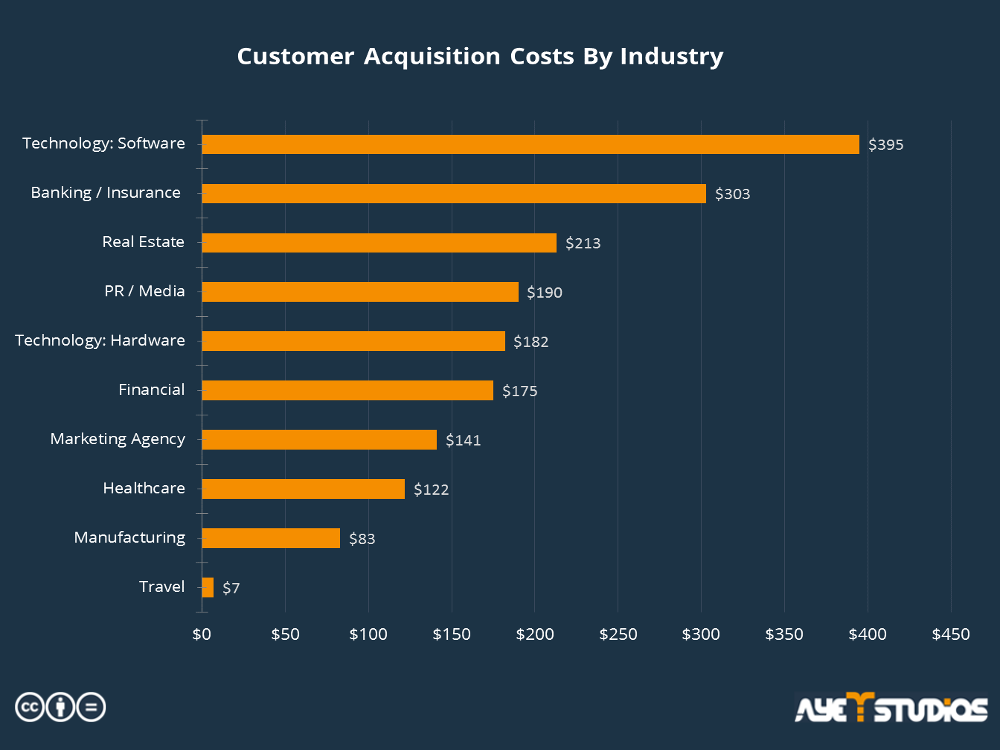
6. Customer Acquisition Cost:
Customer acquisition cost calculates the average cost to get a new customer. It covers marketing and sales costs, so you know if your strategy works.
The CAC Formula is: CAC = Total money spent on Marketing and Sales / New Customers
For example, if a mobile app for language learning spends $10,000 on marketing and advertising campaigns in a month. During that same month, the app acquires 200 new users. the language learning app’s customer acquisition cost is $50.
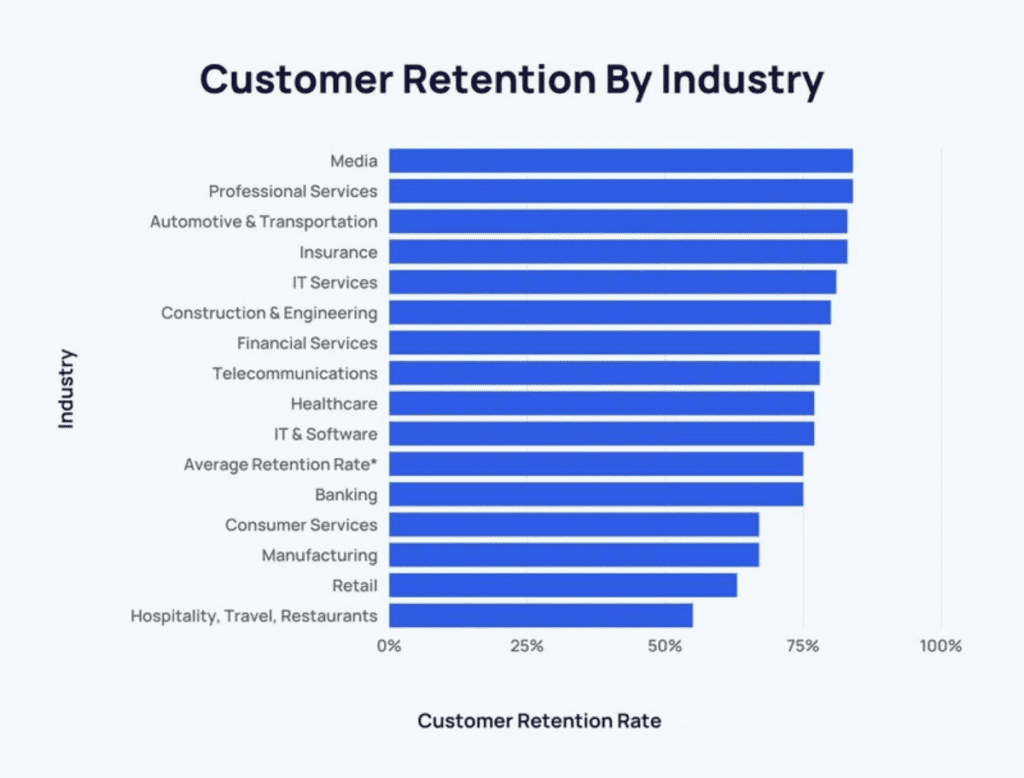
7. Customer Retention Rate:
Customer Retention Rate tells us how many customers stick with a business. It shows if they’re happy and loyal.
Here’s how to get the rate: Customer Retention Rate = [(End Customers – New Customers) / Start Customers] * 100
For example, if a clothing store with 200 customers at the beginning of the year. They add 50 new customers, but by year’s end, only 180 remain. The customer retention rate of 65%.
8. Repeat Purchase Rate:
The Repeat Purchase Rate reveals customers who buy more than once. It shows us their loyalty.
Here’s the formula: Repeat Purchase Rate = (Buyers with More Than One Purchase / All Buyers) * 100
For example, if an online shoe store has 500 unique customers in a single month. Out of these customers, 200 of them return to make a second purchase within that same month. This means the online shoe store has a 40% repeat purchase rate.
9. Return on Investment (ROI):
Return on Investment (ROI) tells if an investment is profitable. It compares the net gain to the cost.
The ROI formula is: ROI = (Net Profit / Investment Cost) * 100
For example, if a company invests $5,000 in a social media marketing campaign over three months. This campaign generates $15,000 in additional sales during that same timeframe. This means the company’s social media marketing campaign generated a 200% return on investment.
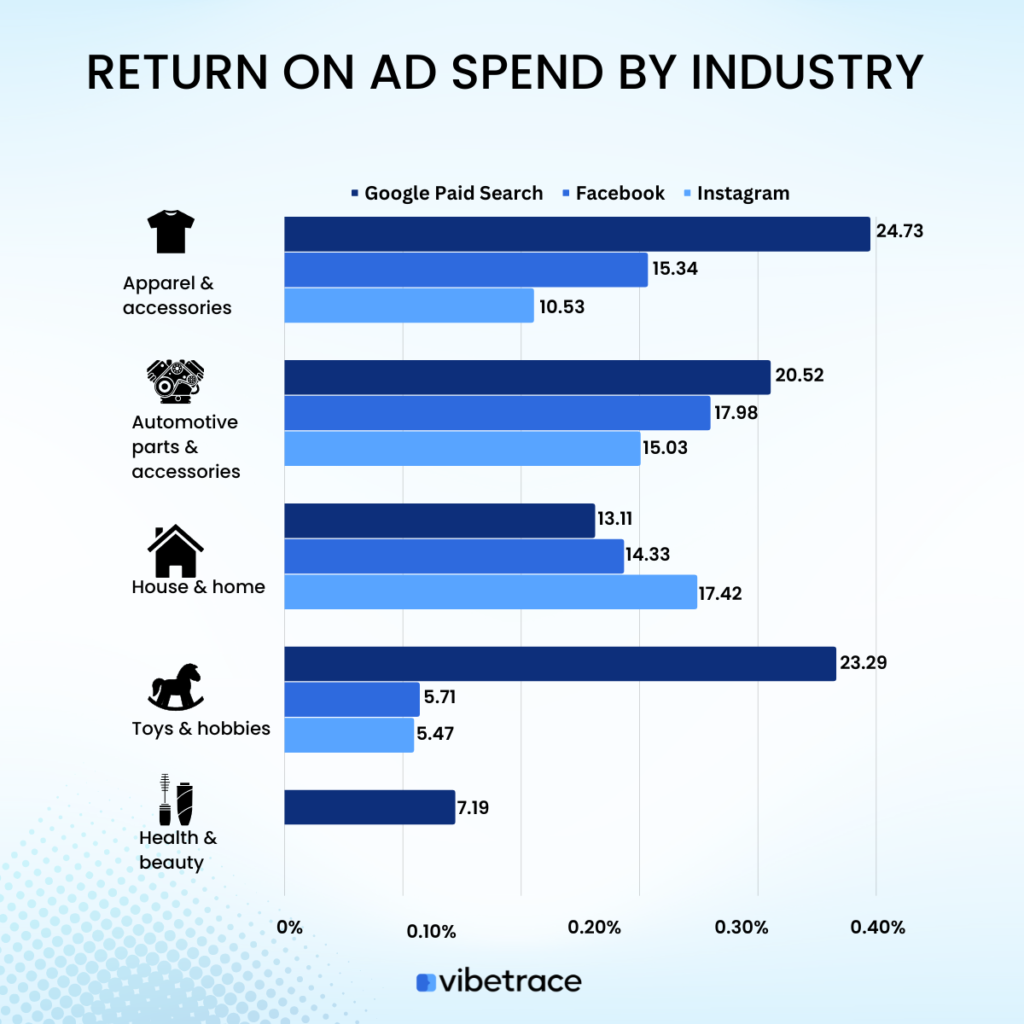
10. Return on Ad Spend (ROAS):
Return on Ad Spend, or ROAS, is a way to measure how successful an ad campaign is. You calculate it by seeing how much money an ad campaign brings in, then dividing it by what the ad campaign costs.
Here’s the formula: ROAS = Money made from Ad / Cost of Ad
For example, if an online clothing store spends $2,000 on advertising a new line of dresses through various online channels. As a result of the campaign, they generate $8,000 in revenue from sales of these dresses. This means that for every $1 they spent on advertising, they generated $4 in revenue from the promoted new dresses.
11. Cost per Acquisition (CPA):
Cost per Acquisition, shortened to CPA, tells us how much money it takes to gain a new customer. It takes into account all the expenses related to an ad campaign.
Here’s the formula: CPA = Total Campaign Cost / Number of New Customers
For example, let’s say a campaign costs $1,000 and brings in 50 new customers. The cost per acquisition would be $20 per customer.
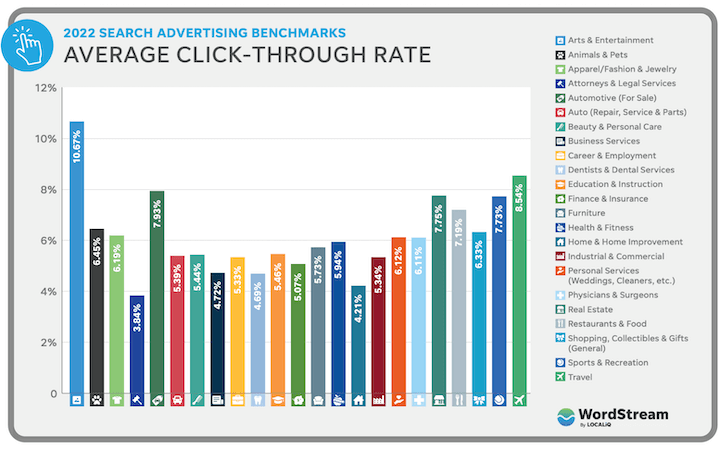
12. Click-Through Rate (CTR):
Click-Through Rate, also known as CTR, rates online ads or email campaigns success by looking at how many people clicked on the ad or link.
Here’s the formula: CTR = (Clicks on the ad / Number of times the ad was shown) * 100
For example, if an online store sends out an email marketing campaign promoting their summer sale. The email is sent to 1,000 subscribers, and 50 of them click on the link within the email that leads to the sale page on their website. This means the click-through rate of the clothing stores is 5%.
13. Cost per Click (CPC):
Cost per Click (CPC) is a pricing model used in online advertising where advertisers pay each time an ad is clicked on.
Here’s the formula: CPC = Total Cost of Campaign / Number of Clicks
For example, if an online course platform runs a pay-per-click (PPC) campaign for a marketing course, setting a maximum bid of $2 per click. The campaign generates 100 clicks, costing a total of $180. The cost per click for this campaign is $1.80.
14. Website Traffic Sources:
Website Traffic Sources categorize the origins of your website visitors, which can include direct traffic, search engines, social media, referrals, and others.
While this is more of a qualitative metric without a single formula, understanding the proportion of traffic from each source can help in optimizing marketing strategies.
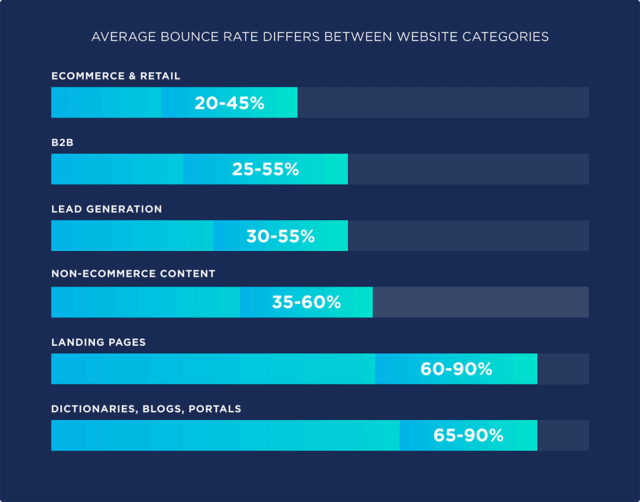
15. Bounce Rate:
Bounce Rate measures the percentage of visitors who navigate away from the site after viewing only one page, indicating the effectiveness of the site in engaging users.
The formula for bounce rate is: Bounce Rate = (Number of Single-Page Visits / Total Visits) * 100
For example, if a travel blog receives 1,000 visitors in a month. However, 700 of them leave the website after only viewing the page they landed on, without exploring other blog posts. This means the travel blog has a 70% bounce rate.
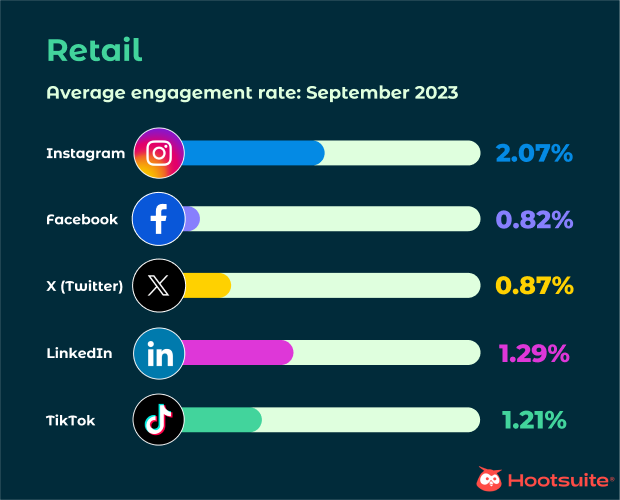
16. Social Media Engagement:
Social Media Engagement quantifies the level of interaction and participation a brand has with its audience on social platforms, including likes, shares, comments, and mentions.
This metric is typically calculated by summing up the total engagement actions and dividing by the total number of impressions, then multiplying by 100 to get a percentage.
17. Social Media Conversion Rate:
Social media conversion rate checks how well your social media encourages people to do things like buy items or sign up.
Here’s the formula: (Social Media Conversions / All Social Media Chats) x 100
For example, if an Instagram ad had 1,000 clicks and 50 resulted in purchases, the conversion rate would be 5%.
18. Average Customer Response Time:
This time shows how long a company takes, on average, to answer customer questions or feedback. It’s vital in customer service.
There’s no set way to find this, but usually, we just add up all the response times and divide by how many customer questions you had.
19. Net Profit Margin:
The Net Profit Margin shows what percent of your money made turns into profit after taking away costs.
Here’s the formula: (Net Profit / Money Made) x 100
For example, if your company made $200,000 and had a net profit of $50,000, the net profit margin is 25%.
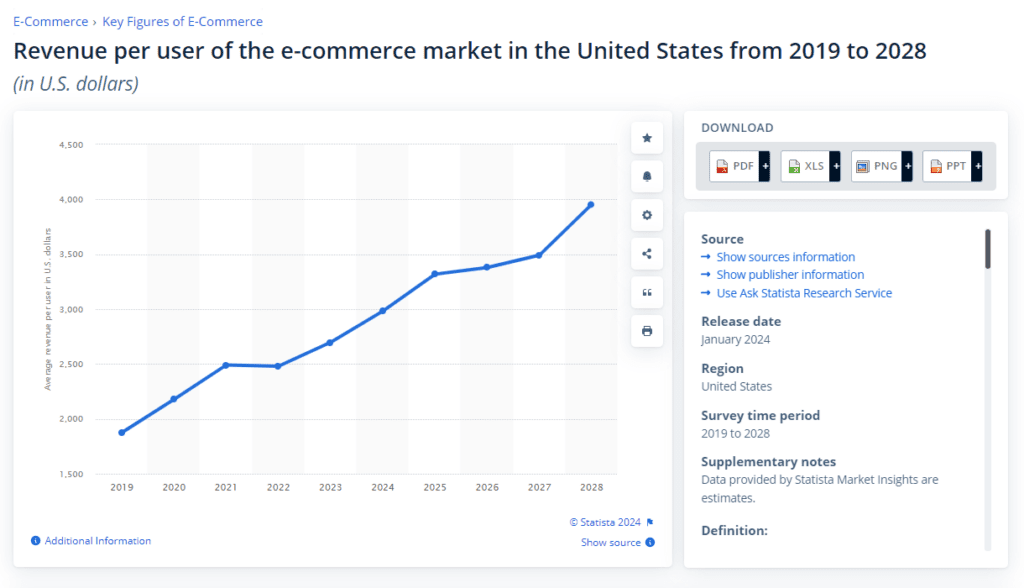
20. Average Revenue per User (ARPU):
The ARPU checks the money made per user. It’s used in areas like phone services and subscription-based services.
Here’s the formula: (All Money Made / Total Number of Users)
For example, if a mobile app has 10,000 active users in a month. Out of these users, 2,000 subscribe to their premium membership, which costs $10 per month. This means the mobile app has an average revenue per user is $2 per user.
Conclusion:
In conclusion, tracking eCommerce KPIs is crucial for eCommerce merchants to make smart decisions and scale their online businesses. These top 20 ecommerce KPIs serve as a compass for businesses in a competitive world.
These metrics, ranging from revenue and conversion rate to social media engagement and net profit margin, offer a comprehensive view of an online store’s health and performance.
As an eCommerce merchant, understanding customer behavior, refining marketing strategies, optimizing user experiences, and making data-driven decisions are pivotal to success.
Each KPI acts as a signpost, providing insights into strengths, weaknesses, and opportunities for improvement. Also, eCommerce businesses can not only measure their current performance but also prepare their strategies for future growth.
Remember, KPIs tell a story about your whole eCommerce business. Go beyond the numbers and identify trends, correlations, and areas for improvement.
By actively monitoring and analyzing your eCommerce KPIs, you gain the power to make data-driven decisions that optimize your online store and propel your business toward sustained success.
So, let’s track, analyze, and optimize these eCommerce KPIs because understanding the most important KPIs is the first step toward success.