


Shopify Analytics is your roadmap to eCommerce success. By tracking the right metrics and making data-driven decisions, you can turn your store into one that generates consistent revenue and growth.
Shopify analytics is like a treasure map, guiding you to insights that can unlock hidden growth potential. By tracking the right metrics, you can optimize your marketing campaigns, boost conversions, and ultimately make more sales.
Shopify analytics can be your secret weapon for uncovering what’s working and what’s not. By tracking key metrics, you can gain laser-sharp focus on what truly drives results.
Knowing exactly which marketing channels are bringing in the most customers, which products are selling more, and what changes you can make to increase conversion rates.
Knowing which marketing channels are bringing in the most customers, which products are selling the most, and what changes you can make to increase conversion rates.
Whether you’re a seasoned Shopify owner or a beginner entrepreneur, understanding what to track and analyze is crucial for optimizing your store and driving sales.
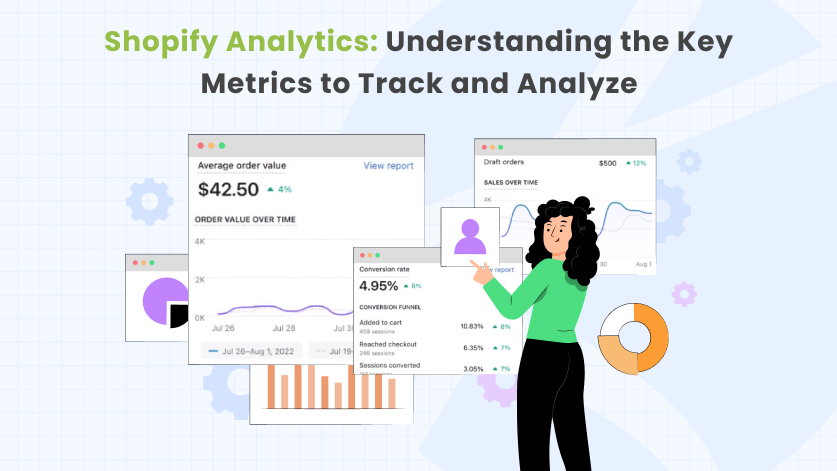
What is Shopify Analytics?
Shopify Analytics is a suite of tools and reports within your Shopify store that help you understand how your business is performing.
Shopify Analytics serves as a dynamic and integrated data interface, continually adapting to the demands of the digital age. This indispensable tool provides invaluable insights into critical indicators, such as customer behavior, website traffic, and sales trends.
Understanding the operations of online stores becomes a necessity for data-driven decision-making, and Shopify Analytics emerges as a linchpin in this process.
The tool assists in procuring valuable insights related to store performance, with 62% of businesses acknowledging that analytics provide them with a competitive advantage.
Shopify Analytics is not merely a choice; it is a strategic imperative for those seeking a competitive edge, consolidating key metrics like sales, traffic, and customer behavior into a singular, actionable dashboard.
As an invaluable tracker, Shopify Analytics generates data reflecting a store’s performance, encompassing crucial metrics like total store sessions, sales figures, customer retention rates, and average order values.
Understanding and leveraging Shopify Analytics is imperative for those seeking sustained growth and success in the digital marketplace, with businesses using analytics reporting an average conversion rate of 2.77%.
Shopify Analytics vs. Google Analytics:
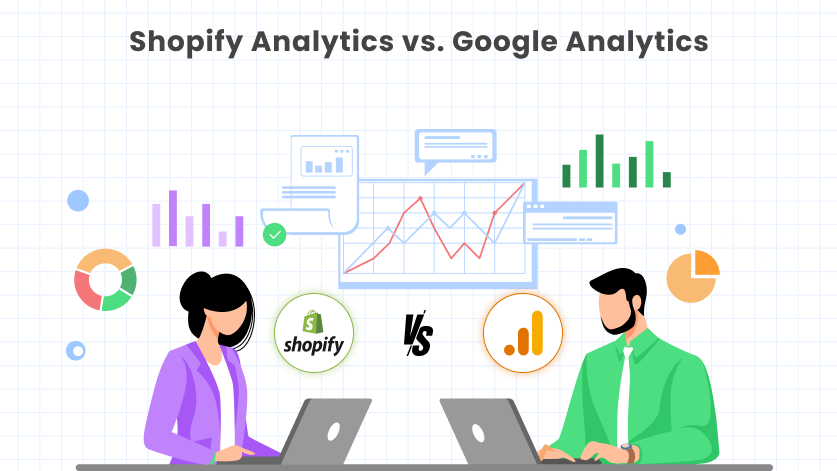
Both Shopify Analytics and Google Analytics offer valuable insights into your online store’s performance, but they target different aspects and have varying strengths. Choosing the right one (or even using both!) depends on your specific needs and goals.
Here’s a detailed comparison to help you decide:
1. Focus:
- Shopify Analytics: Primarily focuses on eCommerce metrics related to sales, conversions, and customer behavior within your Shopify store.
- Google Analytics: Offers a broader view of website traffic, user behavior across all pages, and marketing campaign performance beyond just eCommerce.
2. Metrics:
- Shopify Analytics: Provides detailed insights on conversion rates, average order value, product performance, customer journey within your store, and inventory management.
- Google Analytics: Offers a wider range of metrics, including traffic sources, user engagement (time spent on site, bounce rate, page views), demographics, goal conversions (e.g., newsletter signups, purchases), and marketing campaign effectiveness.
3. Depth:
- Shopify Analytics: Offers sufficient depth for most eCommerce needs and is easy to understand for beginners.
- Google Analytics: Provides more granular data and advanced analysis tools but may require more technical know-how.
4. Data Integration:
- Shopify Analytics: Integrates seamlessly with your Shopify store, offering real-time data and pre-built reports specific to eCommerce.
- Google Analytics: Requires manual installation and configuration on your Shopify store, but it can track data across multiple websites and platforms, providing a more holistic view.
5. Cost:
- Shopify Analytics: Included for free with all Shopify plans.
- Google Analytics: Free basic version with limited features, paid premium plans for advanced features and data storage.
6. Target Audience:
- Shopify Analytics: Ideal for beginners and eCommerce focused users who want quick and easy insights into their Shopify store performance.
- Google Analytics: Geared towards advanced users and businesses with complex websites and marketing campaigns who need in-depth data analysis and reporting.
Shopify Analytics Strengths and Weaknesses:
7. Strengths:
- Ease of Use: Designed specifically for Shopify stores, with a user-friendly interface and pre-built reports tailored to eCommerce metrics.
- Focus on Sales: Provides detailed insights into sales performance, conversion rates, and customer behavior within your store.
- Real-time Data: Offers a live view of key metrics like traffic, sessions, and sales, allowing for quick monitoring and adjustments.
- Integration with Shopify: It seamlessly integrates with your Shopify store, eliminating the need for manual data entry or complex setup.
8. Weakness:
- Limited Data Depth: Provides a more basic level of data compared to Google Analytics, offering less granular insights into website traffic and customer behavior.
- No Cross-Domain Tracking: It cannot track user behavior across multiple domains, which can be limiting for businesses with complex websites or marketing campaigns.
- Fewer Customization Options: Offers less flexibility for creating custom dashboards and reports compared to Google Analytics.
Google Analytics Strengths and Weaknesses:
9. Strengths:
- Comprehensive Data: Offers a vast amount of data about website traffic, user behavior, marketing campaigns, and more, providing a deeper understanding of your audience and online presence.
- Advanced Segmentation and Filtering: Allows for detailed segmentation and filtering of data to gain specific insights into different aspects of your business.
- Cross-Domain Tracking: You can track user behavior across multiple domains, providing a holistic view of their interactions with your brand.
- Customizable Dashboards and Reports: Offers extensive flexibility for creating custom dashboards and reports tailored to your specific needs and goals.
10. Weakness:
- Steeper Learning Curve: Can be more challenging to learn and use compared to Shopify Analytics, especially for non-technical users.
- Less Shopify-Specific: Requires additional configuration to track eCommerce metrics effectively, as it’s not designed specifically for Shopify stores.
Here’s a quick summary:
Why Shopify Analytics is Crucial for Shopify Owners:
Shopify Analytics is your window into the soul of your store. It provides invaluable data and insights that can help you make informed decisions, optimize your operations, and ultimately boost your sales.
Here’s why it’s crucial for every Shopify owner:
1. Understand Your Customers:
1. Who are they? Analytics reveals demographics like age, gender, location, and interests, helping you tailor your products and marketing to their preferences.
2. What do they do? Track your consumer behavior within your store, from browsing patterns to purchase decisions. Identify popular products, conversion bottlenecks, and areas for improvement.
3. What do they want? Analyze customer reviews, ratings, and social media mentions to understand their needs and pain points. This allows you to develop products and services that truly resonate with them.
2. Optimize Your Marketing:
1. Track the effectiveness of your campaigns: Analytics shows you which marketing channels are driving traffic and sales, allowing you to allocate your budget more efficiently.
2. Identify underperforming campaigns: Analyze data to pinpoint campaigns that aren’t generating results and make adjustments to improve their performance.
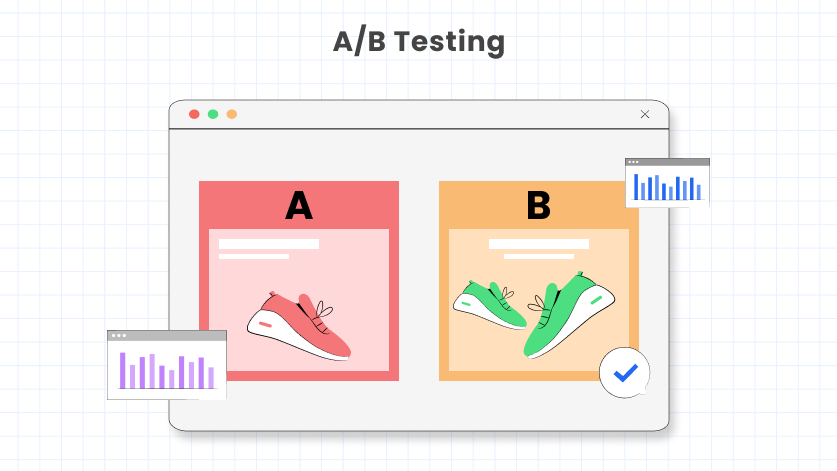
3. Test and refine your strategies: Use A/B testing to compare different headlines, calls to action, and website layouts to see what resonates best with your audience.
3. Make Data-Driven Decisions:
1. Go beyond gut feelings: Analytics provides concrete data to back up your decisions, reducing the risk of costly mistakes.
2. Predict future trends: Analyze historical data to identify patterns and anticipate future customer behavior, allowing you to prepare for seasonal changes or product launches.
3. Stay ahead of the competition: By constantly monitoring and analyzing data, you can identify new opportunities and adapt to changing market trends before your competitors.
4. Improve Your Store Performance:
1. Identify and fix conversion killers: Analytics can pinpoint areas in your checkout process that are causing customers to abandon their carts, allowing you to streamline the process and increase the conversion rate.
2. Optimize your product mix: Monitor the performance of your products to identify top sellers and low sellers products. Utilize this information to guide your product development and improve your inventory management strategy with Shopify inventory management apps.
3. Personalize the customer experience: Use data to segment your customers and deliver targeted recommendations and promotions, increasing customer loyalty and engagement.
Shopify Analytics is a powerful tool that can be leveraged to unlock the full potential of your online store. By understanding your customers, optimizing your marketing, making data-driven decisions, and improving your store’s performance, you can set yourself up for success in the competitive world of eCommerce.
Key Metrics to Track and Analyze for Every Shopify Owner:
Running a successful Shopify store requires more than just beautiful products and compelling marketing.
It’s crucial to understand how your store is performing and make data-driven decisions for improvement. This is where key metrics come in; they are your compass, guiding you towards growth and optimization.
Here are some of the most important metrics every Shopify owner should track and analyze:
1. Traffic Metrics:
1. Unique Visitors: Understand how many people visit your store. This gives you a sense of your audience size and reach.
2. Traffic Sources: Where are your visitors coming from? Analyze the breakdown of direct, referral, organic search, and social media traffic to understand your most effective marketing channels.
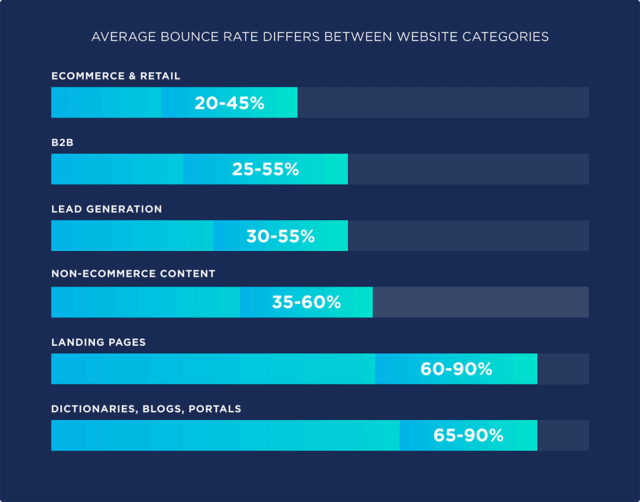
3. Bounce Rate: How many visitors leave your site without interacting? A high bounce rate could indicate poor website design or irrelevant content.
4. Average Session Duration: How long do visitors stay on your site? This shows their level of engagement and interest in your products.
2. Sales Metrics:
1. Conversion Rate: The conversion rate is the percentage of visitors who make a purchase. This is a crucial metric for measuring your website’s effectiveness in turning browsers into buyers.
2. Average Order Value (AOV): Understand how much customers spend per order. Analyze product bundles, upsells, and discounts to increase average order value (AOV).
3. Sales by Product Category: Which products are selling well and which ones are lagging behind? This data guides your inventory management and product development decisions.
4. Abandoned Cart Rate: How many customers leave items in their cart without completing the purchase? Analyze this to identify and fix conversion roadblocks to reduce cart abandonment rates.
3. Customer Behavior Metrics:
1. Customer Journey Mapping: Track how customers navigate your store, from product discovery to checkout. This reveals potential friction points and areas for improvement.
2. Time Spent on Product Pages: How long do customers spend looking at individual products? This can indicate their level of interest and purchase intent.
3. Click-Through Rate (CTR) on Calls to Action (CTAs): How effective are your CTAs in encouraging desired actions, like buying or signing up for an email list?
4. Financial Metrics:
1. Revenue: This is your total income from sales. Track overall revenue growth and identify any seasonal trends.
2. Profit Margin: How much profit do you make after deducting your costs? This metric helps you understand your financial health and pricing strategy.
3. Return on Investment (ROI): Are your marketing and advertising efforts paying off? Calculate the return on investment (ROI) to measure the effectiveness of your investments.
5. Marketing Campaign Metrics:
1. Email Marketing Performance: Track open rates, click-through rates, and conversion rates for your email campaigns to understand their effectiveness.
2. Ad Campaign Analysis: Analyze the performance of your paid advertising across platforms like Facebook Ads and Google Ads to see which campaigns are driving the most traffic and sales.
3. Social Media Engagement: Monitor your reach, likes, comments, and shares on social media platforms to gauge your brand awareness and community engagement.
6. Remember:
- Track these metrics regularly, not just occasionally: Consistency is key to identifying trends and making informed decisions.
- Don’t get overwhelmed by data: Focus on the metrics that are most relevant to your specific business goals.
- Use data to tell a story: Analyze the trends and relationships between different metrics to gain deeper insights into your store’s performance.
- Take action based on your findings: Don’t just collect data; use it to make changes and improve your store’s performance.
By tracking and analyzing these key metrics, you’ll gain valuable insights into your customers, your marketing efforts, and your overall store performance. This knowledge will empower you to make data-driven decisions, optimize your operations, and ultimately achieve your eCommerce goals.
How to Navigate Shopify Analytics in the Shopify Store:
Navigating Shopify Analytics can feel daunting at first, but with a bit of guidance, it becomes a powerful tool for understanding your store’s performance and making informed decisions.
Here’s a comprehensive guide to help you navigate Shopify Analytics:
1. Accessing the Dashboard:
- Log in to your Shopify admin panel.
- Click on “Analytics” in the left-hand menu.
- You’ll land on the Overview Dashboard, which displays key metrics like sales, traffic, and conversions for the past 30 days.
2. Exploring Different Sections:
- Reports: This section offers various reports on specific areas like sales, marketing, customers, and inventory.
- Live View: Get real-time insights into your website traffic, including unique visitors, page views, and current orders.
- Custom Reports: Create your own reports by selecting specific metrics and date ranges.
3. Understanding Key Metrics:
- Traffic: Focus on unique visitors, traffic sources, bounce rate, and time spent on site.
- Sales: Track conversion rate, average order value (AOV), sales by product category, and abandoned cart rate.
- Customers: Analyze customer journey mapping, time spent on product pages, and customer reviews and ratings.
- Inventory: Monitor stock levels and inventory turnover rate to avoid overstocking or understocking.
- Marketing: Track email marketing performance, ad campaign analysis, and social media engagement.
4. Utilizing Filters and Drill-Downs:
- Use filters to narrow down your data by date range, product category, traffic source, and other criteria.
- Click on specific data points to drill down and see more detailed information. For example, clicking on “Sales” might reveal specific product performance.
5. Customizing Your Dashboard:
- You can add or remove widgets on the Overview Dashboard to personalize them with the metrics you find most valuable.
- Click on the gear icon and select “Customize dashboard” to make adjustments.
6. Exporting Data:
- Export your data as a CSV file for further analysis in Excel or other spreadsheet programs.
- This allows you to create custom charts, graphs, and reports tailored to your specific needs.
Conclusion:
In conclusion, Shopify Analytics serves as a roadmap for optimizing marketing strategies, enhancing customer experiences, and boosting overall store performance.
By understanding and leveraging key metrics, Shopify owners can unlock hidden growth potential, optimize marketing strategies, and ultimately drive consistent revenue and success.
The comparison between Shopify Analytics and Google Analytics underscores the importance of choosing the right analytical tool based on individual business needs and goals.
While Shopify Analytics excels in its ease of use, focus on eCommerce metrics and seamless integration with Shopify stores, Google Analytics offers a broader perspective with more advanced features suitable for complex websites and diverse marketing campaigns.
Remember to regularly track and analyze these metrics, ensuring consistency in monitoring trends and making well-informed decisions. Don’t be overwhelmed by the data; instead, focus on the metrics that align with your specific business goals.
So, dive into the analytics, track those key metrics, and let your data tell the story of your eCommerce store.