


Shopify Analytics and Google Analytics serve as the backbone of informed decision-making, offering insights that show the path to success.
In this comprehensive blog post, we’ll deep dive into Shopify Analytics vs. Google Analytics in 2024.
We’ll compare their functionalities, strengths, weaknesses, and compare Shopify analytics and Google analytics.
By the end, you’ll have a clear understanding of each platform, enabling you to make an informed decision and unlock the full potential of your data-driven eCommerce strategy.
What is Shopify Analytics:
Shopify Analytics is a built-in analytics tool provided by the Shopify eCommerce platform. It is designed specifically for online merchants using Shopify to run their stores.
The primary focus is on delivering insights related to eCommerce performance, allowing merchants to track and analyze various aspects of their online business.
Here are the key features of Shopify analytics:
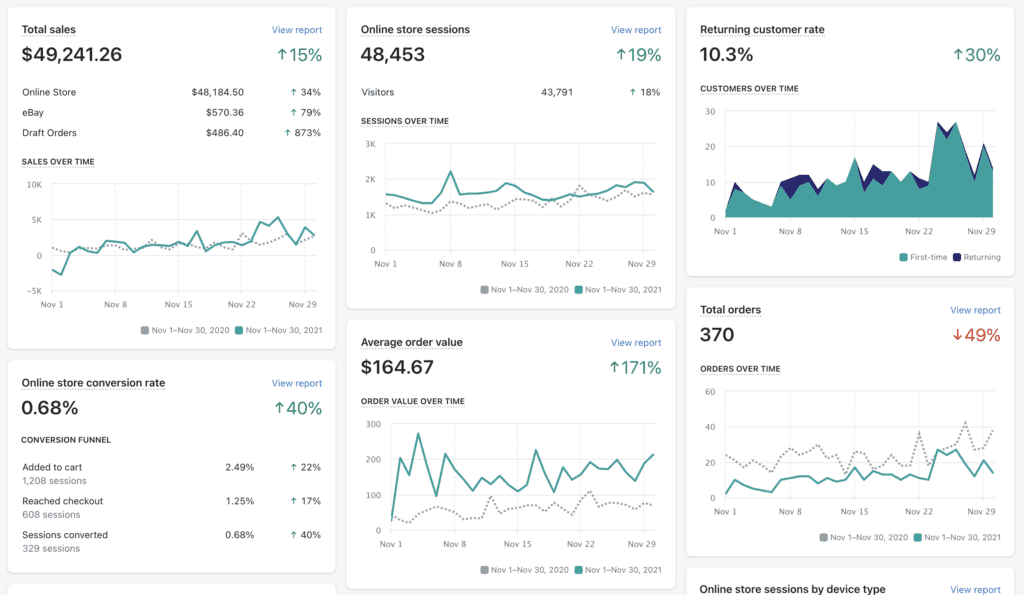
- Sales Reports: Shopify Analytics provides detailed reports on sales, allowing merchants to track revenue, order volume, and average order value.
- Customer Behavior: Merchants can analyze customer behavior, including how visitors navigate through their store, which products are popular, and where customers may drop off in the purchase process.
- Product Performance: Shopify Analytics offers insights into the performance of individual products, helping merchants identify top-selling items and make informed decisions about inventory and marketing strategies.
- Custom Reports: Users can create custom reports to focus on specific metrics relevant to their business goals.
- Real-time Data: Shopify Analytics provides real-time data, giving merchants immediate insights into their store’s performance.
- Financial Metrics: It includes financial metrics like gross profit, net profit, and other key financial indicators.
What is Google Analytics:
Google Analytics is a powerful and widely used web analytics service provided by Google. It is not specifically tailored for eCommerce but offers a comprehensive suite of tools to analyze website traffic, user behavior, and other aspects of online performance.
Here are the key features of Google analytics:
- Traffic Analysis: Google Analytics tracks website traffic, providing insights into the sources of traffic, user demographics, and user behavior.
- Cross-Platform Tracking: It allows tracking user interactions across different devices and platforms, providing a holistic view of the customer journey.
- Customization: Google Analytics is highly customizable, enabling users to create custom reports, set up goals, and track specific metrics based on their business objectives.
- eCommerce Tracking: Google Analytics includes eCommerce tracking features to monitor online transactions, revenue, and user interactions on eCommerce websites.
- Event Tracking: Users can set up event tracking to monitor specific actions or interactions on their website, such as clicks on buttons or form submissions.
Why is Analytics so Important for eCommerce Business?
1. Customer Insights: Analytics reveal who your customers are, where they come from, what they’re interested in, and how they interact with your online store. This knowledge allows you to customize your marketing strategy, product offerings, and overall user experience to resonate with your target audience.
2. Performance Measurement: Track key metrics like sales, conversion rates, and average order value to understand what’s working and what’s not. This data allows you to optimize your store, identify areas for improvement, and ultimately increase your sales.
3. Identifying Trends: Analytics allows you to identify trends in customer behavior and market shifts. This foresight enables you to make proactive decisions, stay ahead of the competition, and adjust your strategies to take advantage of new opportunities.
4. Marketing Effectiveness: To understand what drives traffic and conversions, track the effectiveness of your marketing campaigns across multiple channels (social media, email, and paid ads). This data allows you to allocate your marketing budget more efficiently and optimize your campaigns for maximum impact.
5. Inventory Management: Analyze product performance data for informed decisions on stocking levels, promotions, and new product offerings. This helps you avoid overstocking and ensures you have the right products available to meet customer demand.
Feature-by-Feature Comparison: Shopify Analytics vs. Google Analytics:
Now that we understand the importance of analytics and the general key features of each platform, let’s delve deeper into specific features to guide your decision:
A. Sales and Revenue Analytics:
1. Shopify’s Sales Analytics Capabilities:
- Sales Reports: Shopify provides detailed sales reports that include information on revenue, order volume, and average order value. Merchants can track sales performance over time, allowing for trend analysis and strategic decision-making.
- Product Performance: Shopify Analytics offers insights into individual product performance, helping merchants identify top-selling products and understand which items contribute most to revenue.
- Financial Metrics: Beyond sales, Shopify Analytics provides financial metrics like gross profit and net profit, giving a comprehensive view of the financial health of the business.
2. Google Analytics’ Revenue Tracking Features:
- eCommerce Tracking: Google Analytics includes eCommerce tracking features that enable users to monitor online transactions, revenue, and other key metrics specific to eCommerce websites.
- Conversion Tracking: It tracks conversion goals, allowing users to set up and measure specific actions or milestones that contribute to revenue generation, such as completing a purchase or filling out a lead form.
- Multi-Channel Funnels: Google Analytics provides insights into the various touchpoints that contribute to a conversion, helping businesses understand the customer journey leading to profits.
B. Customer Behavior Analysis:
1. Shopify’s Customer Behavior Tools:
- Customer Behavior: Shopify Analytics allows merchants to analyze customer behavior and how the customer navigates their online store, including page views, time spent on pages, and entry/exit pages.
- Cart Abandonment: Merchants can track and analyze cart abandonment rates, identifying where potential customers drop off during the checkout process.
- Customer Segmentation: Shopify enables the segmentation of customers based on various criteria, allowing for targeted marketing efforts and personalized experiences.
2. Google Analytics’ Customer Engagement Metrics:
- Traffic Sources: Google Analytics provides detailed information on where website traffic is coming from, including organic search, direct traffic, and referral sources.
- Customer Flow Analysis: Merchants can analyze the flow of customers through the website, understanding the sequence of pages viewed and interactions made.
- Event Tracking: Google Analytics allows for the tracking of specific events or interactions on the website, providing insights into user engagement beyond pageviews.
C. Inventory Management:
1. Shopify’s Inventory Tracking:
- Stock Levels: Merchants can track and manage inventory levels in Shopify, receiving alerts for low stock to avoid potential stockouts.
- Third-Party Apps: Shopify supports third-party inventory management apps for managing product variants such as different sizes or colors, thereby streamlining inventory tracking for a diverse range of product offerings.
2. Google Analytics’ Inventory-Related Features:
- Limited Inventory Focus: Google Analytics itself does not have specific features for inventory management. It primarily focuses on website analytics, traffic, and customer behavior.
- Integration Possibilities: Merchants may use third-party integrations or additional tools alongside Google Analytics to manage inventory, but it is not a native feature of Google Analytics.
Customization in Shopify Analytics vs. Google Analytics:
Customization Option Within Shopify Analytics:
Shopify Analytics offers built-in dashboards and reports but also allows some level of customization for specific needs.
Here’s what you can do:
- Built-in Dashboard Customization: You can choose which metrics to display on your main dashboard, allowing you to focus on what matters most for your business.
- Custom Reports: Advanced Shopify and Shopify Plus plans allow you to create custom reports with specific filters and columns, tailoring them to answer specific questions.
- Third-Party Apps: A vast ecosystem of Shopify apps provides additional reporting features, such as advanced segmentation, cohort analysis, and marketing campaign tracking.
- Data Export: You can export data from Shopify to other analytics tools for deeper analysis and integration with other data sources.
Limitations of Shopify Analytics:
- Limited Data Visualization Options: Shopify’s built-in reporting offers basic visualizations, which may not be enough for complex analysis.
- Limited Access to Raw Data: You have limited access to the raw data behind the reports, making advanced data manipulation difficult.
- Limited Customizability of Default Reports: While you can add filters and columns, the basic structure of the reports cannot be changed.
Customization Options within Google Analytics:
Google Analytics offers extensive customization options for even more control over your data.
Here’s what you can do:
- Advanced Segmentation: You can segment your data by various factors like demographics, traffic source, device, and behavior to understand your audience better.
- Custom Funnels and Goals: Define specific user journeys and conversion points to measure your marketing campaigns’ effectiveness accurately.
- Custom Reports and Dashboards: Create highly personalized reports and dashboards tailored to your unique business needs and KPIs.
- Custom Dimensions and Metrics: Define custom metrics and dimensions to track specific data points not captured by default in Google Analytics.
- Looker Studio Integration: Combine data from Google Analytics with other sources in Google Looker Studio for visually compelling reports and dashboards.
Limitations of Google Analytics:
- Steeper Learning Curve: Google Analytics offers more features, which can be overwhelming for beginners.
- Requires Coding Knowledge for Advanced Customizations: Setting up custom dimensions, metrics, and funnels often requires some coding knowledge.
- Can be Expensive for Large Businesses: Google Analytics offers a free tier, but advanced features require a paid subscription, which can be expensive for large businesses with high data volumes.
Flexibility and Scalability of Each Platform:
Both platforms offer flexibility and scalability, but in different ways:
- Shopify Analytics: More user-friendly for beginners, with basic customization options readily available. However, it may not scale well as your business grows and requires more complex analysis.
- Google Analytics: Highly scalable and flexible, offering advanced features and customization options suitable for large businesses with complex needs. However, it requires more technical knowledge and can be more complex to set up and use.
Ultimately, the best platform for you depends on your specific needs and technical expertise:
Choose Shopify Analytics if:
- You’re a small business with basic reporting needs.
- You prefer a user-friendly interface.
- You’re comfortable with limited customization options.
Choose Google Analytics if:
- You’re a medium or large business with complex reporting needs.
- You have technical expertise or are willing to invest in learning.
- You require advanced features and customization options.
How to Leverage Analytics for Better Decision-Making:
Leveraging analytics for better decision-making involves using data-driven insights to inform and guide your decision-making processes.
This can be applied in various fields such as business, healthcare, finance, and more.
Here’s a guide on how to leverage analytics for better decision-making:
1. Define Clear Objectives: Clearly outline the objectives and goals you want to achieve through analytics. Understand the specific decisions you need to make and the information required to support those decisions.
2. Data Collection: Gather relevant data from various sources. This can include internal sources such as databases, CRM systems, and external sources like market reports, surveys, and social media. Ensure that the data is accurate, up-to-date, and relevant to your objectives.
3. Data Cleaning and Integration: Clean and preprocess the data to remove errors, inconsistencies, and missing values. Integrate data from different sources to create a comprehensive dataset that provides a holistic view of the situation.
4. Data Analysis: Apply statistical and analytical techniques to extract meaningful insights from the data. This may involve descriptive statistics, data visualization, correlation analysis, and predictive modeling. Identify patterns, trends, and relationships within the data.
5. Build Dashboards and Reports: Create user-friendly dashboards and reports that present key findings in a visually comprehensible manner. Dashboards can help stakeholders quickly understand the data and make informed decisions.
6. Implement Predictive Analytics: Use predictive analytics to forecast future trends and outcomes. This can help in proactive decision-making, allowing you to anticipate changes and plan accordingly.
7. Continuous Monitoring: Implement a system for continuous monitoring of key performance indicators (KPIs) and other relevant metrics. Regularly update your data and analyses to stay informed about changes in your business environment.
Learn more about Shopify analytics for key metrics to track and analyze your Shopify store.
Conclusion:
In conclusion, Shopify analytics and Google analytics both offer valuable tools for understanding your online store’s performance and optimizing your eCommerce strategy.
But with distinct strengths and weaknesses, the best platform for you depends on your specific needs and technical expertise.
For small businesses with basic reporting needs and a preference for user-friendliness, Shopify analytics is a strong contender.
Its built-in dashboards, custom report options, and third-party app integrations provide valuable insights without overwhelming complexity.
However, if you’re a medium or large business with complex reporting requirements and technical know-how, Google analytics is good for your business.
Its extensive customization options, advanced features like funnels and segments, and robust data manipulation capabilities empower you to delve deep into your data and uncover hidden gems.
Ultimately, the best way to choose is to experiment with both platforms and see which one aligns best with your comfort level, technical abilities, and business goals.
Remember, data-driven decisions are crucial for eCommerce success, so don’t underestimate the power of choosing the right analytics platform to guide your journey.